![]()
The Free Market Center
![]()
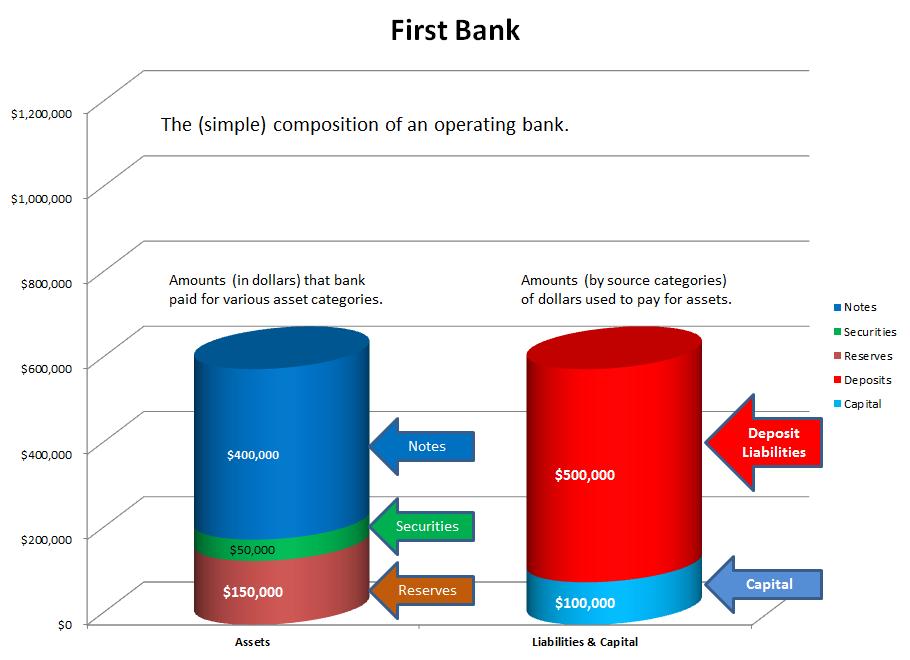
In order to discuss what regulations influence the answers to the three questions posed, we need a hypothetical bank as a model. The image above represents the model bank, which I have dubbed First Bank. Using this diagram I will set up the elements of First Bank that I will refer to in the balance of this presentation.
The left-hand column in the graph represents the amounts of dollars that the bank paid for assets in each of three general categories:
$50,000 in securities, consisting primarily of US government bonds.
$400,000 in notes, representing the future obligations of bank customers to the bank.
The right-hand column of this chart represents the amounts and sources of the money used to acquire the assets of the bank. For this example sources fall into two general categories:
© 2010—2020 The Free Market Center & James B. Berger. All rights reserved.
To contact Jim Berger, e-mail: