![]()
![]()
A Short Course in Bank Accounting
Accounting systems have been designed to show the transactions that reflect the sources and uses of money by an economic entity. Those entries that reflect uses are referred to as debits (which appear on the left of the ledger), and those that reflect sources are referred to as credits (which appear on the right of the ledger).
Transaction entries reflect the sources (credit) and uses (debit) of money during a particular period of time. They reflect the flows of funds. The amount of money recorded for the sale of an economic good and the amount of money recorded as received from a money loan (or the sale of a note) both represent examples of transaction sources. The amount of money recorded for the purchase of an economic good and the amount of money recorded for a money loan payment (or the repurchase of a note) represent examples of transaction uses.
Accounting systems have been designed to account for the sources and uses of all money transactions by a particular entity. Thus, for every transaction entry for that entity, the money amount of debits must equal the money amount of credits.
Balance entries reflect the accumulation of sources (credits) and uses (debits) of money since the opening of the books for that particular economic entity. Those entries would reflect the stock of goods—in money prices. The net accumulated purchases (all purchases minus all sales) of a particular category of economic good would show as a debit balance entry (all debit transactions minus all credit transactions). The net accumulated loans outstanding of a particular type (all borrowing transactions minus all repayment transactions) would show as a credit balance entry (all credit transactions minus all debit transactions).
Balancing entries fall into one of three categories of accounts: assets, liabilities, and capital.
Asset accounts record the net accumulated uses (debit) of money to acquire various categories of economic goods. Asset accounts show the net amount of money paid by the entity for the asset; they do not reflect value.
Liability accounts record the net accumulated sources (credit) of money from various lenders. These accounts categorize liabilities by type and repayment term.
Capital accounts record the net accumulated sources (credit) of money from various investors/owners. The net amount of assets (stated in terms of money prices) represented by Capital generally stays in the company – unless paid out in dividends, at the discretion of the company.
Since the debit and credit transaction accounts must equal (balance), the accumulation of those transactions in balance accounts must also equal (balance). Thus, total assets, which amounts to a total uses, must equal total liabilities plus total capital, which amount to total sources. (All stated in terms of the money prices paid and received.)
A couple of tables help to summarize all this information about debits and credits and transaction and balance accounts. The first table shows transaction account entries:
| Debit | Credit | |
|---|---|---|
| Assets | Use (Bought) | Source (Sold) |
| Liabilities | Use (Repaid) | Source (Borrowed) |
| Capital | Use (Dividends paid) | Source (Invested) |
The dollar amounts paid for goods that get bought (debit) and sold (credit) are recorded under the general category of assets.
The dollar amounts that are borrowed (credit) and repaid (debit) are recorded under the general category of liabilities.
The dollar amounts of money invested (credit) in the company and the amount of dividends paid (debit) get recorded under the general category of capital.
Over time the transactions described above are accumulated in balance accounts and presented in the form of a balance sheet, which reflects those accumulations (or balances) at a single point in time.
| Assets | Liabilities & Capital | ||
|---|---|---|---|
| Categories of Assets | Net Bought (Use) | Categories of Liabilities | Net Borrowed (Source) |
| Categories of Capital | Net Invested (Source) | ||
The net amount of money spent to buy assets in various categories gets recorded under the general heading of assets.
The net amount of money borrowed within various categories of liabilities gets recorded under the general heading of liabilities and capital.
The net amount of money invested in the entity (initial investment plus earnings less dividends) within various categories of capital get recorded under the general heading of liabilities and capital.
The total amount of assets will equal the total amounts of liabilities and capital, as mentioned before.
With each of the pages in this presentation I have presented a break-down of the transactions at the above and a graphic representation of the balance sheets below the transactions. To show how to interpret that presentation I will—using pages from later in the presentation—describe the transactions and the balances before and after the transactions.
To demonstrate the connection from the description of bank accounting above to the pages in the presentation I will provide that description in three formats
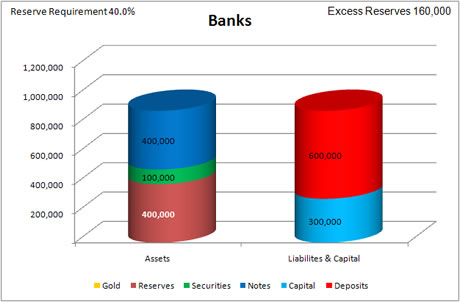
The Banks sell Securities as a source (credit) for 100,000 M-oz. of the Fantasy Banking System money. They record 100,000 R-oz. in their Reserves account as a use (debit).
At the same time...
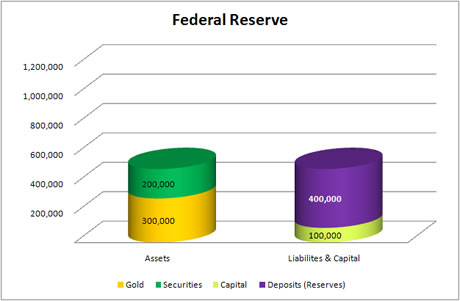
The Fed buys securities as a use (debit) for 100,000 M-oz. of the Fantasy Banking System money. They record 100,000 R-oz. in their Deposit Liabilities to The Banks (Reserves) account as a source (credit).
These three tables that will: 1) show account balances before transactions, 2) show the sample transaction, and 3) show account balances after transactions.
Account Balances - Before Transactions
| Assets (Debit) | Liabilities & Capital (Credit) | ||
|---|---|---|---|
| Gold | 0 | Deposit Liabilities to Customers | 600,000 |
| Reserves | 400,000 | Capital | 300,000 |
| Securities | 100,000 | ||
| Notes | 400,000 | ||
| Totals | 900,000 | 900,000 | |
| Assets (Debit) | Liabilities & Capital (Credit) | ||
|---|---|---|---|
| Gold | 300,000 | Deposit Liabilities to The Banks (Reserves) | 400,000 |
| Securities | 200,000 | Capital | 100,000 |
| Totals | 500,000 | 500,000 | |
Transactions
| Assets | Liabilities & Capital | ||
|---|---|---|---|
| Gold | 0 | Deposit Liabilities to Customers | 0 |
| Reserves | 100,000 Debit | Capital | 0 |
| Securities | 100,000 Credit | ||
| Notes | 0 | ||
| Totals | 0 | 0 | |
(Since these transactions effect the same side of the ledger their total equals zero (0).)
| Assets | Liabilities & Capital | ||
|---|---|---|---|
| Gold | 0 | Deposit Liabilities to The Banks (Reserves) | 100,000 Credit |
| Securities | 100,000 Debit | Capital | 0 |
| Totals | 100,000 Debit | 100,000 Credit | |
Account Balances - After Transactions
| Assets (Debit) | Liabilities & Capital (Credit) | ||
|---|---|---|---|
| Gold | 0 | Deposit Liabilities to Customers | 600,000 |
| Reserves | 400,000 | Capital | 300,000 |
| Securities | 100,000 | ||
| Notes | 400,000 | ||
| Totals | 900,000 | 900,000 | |
| Assets (Debit) | Liabilities & Capital (Credit) | ||
|---|---|---|---|
| Gold | 300,000 | Deposit Liabilities to The Banks (Reserves) | 400,000 |
| Securities | 200,000 | Capital | 100,000 |
| Totals | 500,000 | 500,000 | |
The following graphic shows, in the format used in the "presentation," the same information presented in the description and tables above.
The tables above the charts show the entries representing the transactions, the charts show the account balances after the transaction, and, when you click on the "view before transactions" button, you'll see the charts showing the account balances before the transactions.
| Assets | Liabilities & Capital |
|---|---|
|
| Assets | Liabilities & Capital |
|---|---|
Increase Securities by 100,000 M-oz. |
Increase Deposit Liabilities (Reserves) by 100,000 R-oz. |