The Free Market Center
The Free Market Center
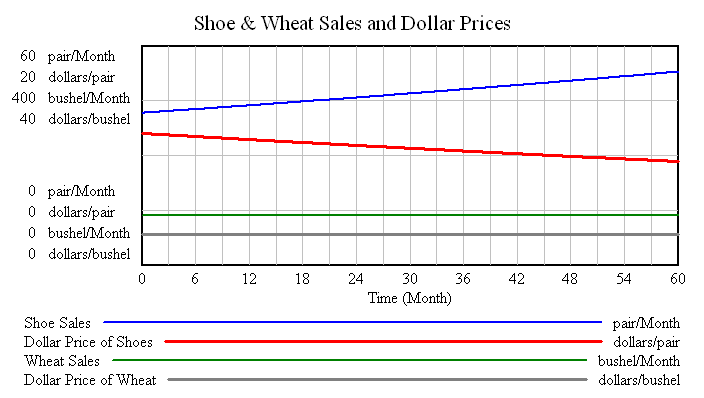
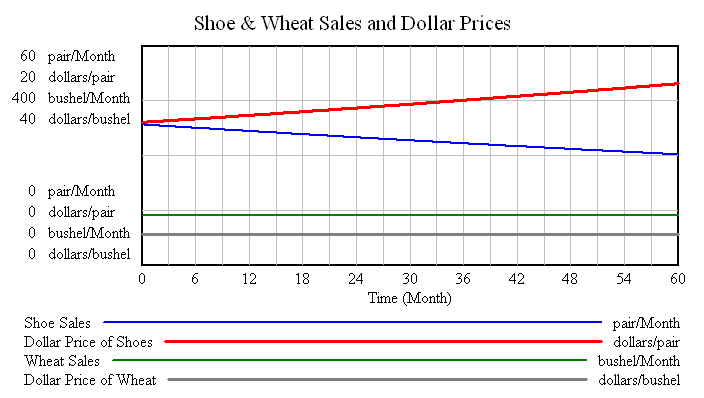
In this scenario the supply of money remains fixed while the production of shoes first increases (first chart) then decreases (second chart.)
| Shoe Production Increases | 2.00%/Month |
| Wheat Production Fixed | 0.00%/Month |
| Money Supply Fixed | 0.00%/Month |

| Shoe Production Decreases | -2.00%/Month |
| Wheat Production Fixed | 0.00%/Month |
| Money Supply Fixed | 0.00%/Month |

© 2010—2020 The Free Market Center & James B. Berger. All rights reserved.
To contact Jim Berger, e-mail:
Without the interference caused by changes in the quantity of money, prices provide information as they should. The first chart shows how, when production and sales increase, dollar prices decline. The second chart shows how, when production and sales decrease, dollar prices rise. Thus, by watching the trend of dollar prices actors in the market can determine whether production has risen or fallen.