The Free Market Center
The Free Market Center
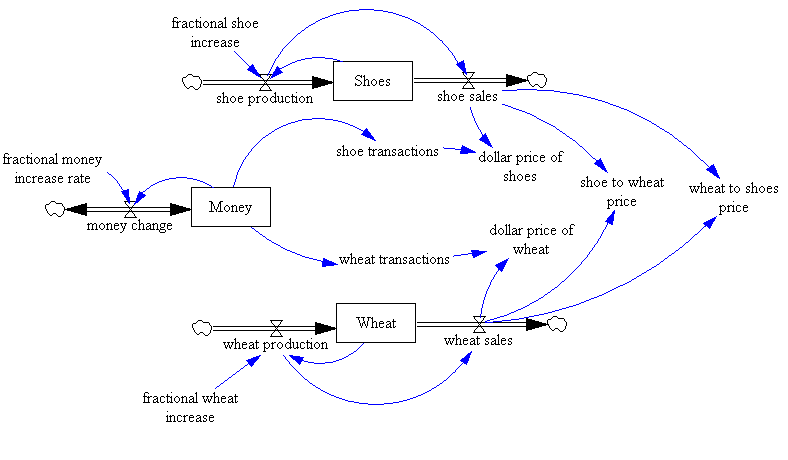
I created the figure below using the system dynamics software, Vensim. I started with the "stock and flow" diagram you see here; then using mathematical formulas embedded in the diagram it generates the "behavior over time" charts that you will see in pages that follow.
I will not describe the development of the "stock and flow" diagram model here, but I have given the important assumptions for this model on the previous page.

© 2010—2020 The Free Market Center & James B. Berger. All rights reserved.
To contact Jim Berger, e-mail:
Important Distinctions
Although I have not gone into the detail of the development of the "stock and flow" diagram model, the distinction between flows and stocks have significance to the descriptions on the following pages.
Dollars/Shoes prices equal the ratio of the amount of money (half the total) spent each month to the sales of shoes (in pairs).
I have provided this detail so you can better understand the charts on the following pages. Just keep in mind the one important distinction:
In the next section we will examine direct exchange—one good exchanged for another.