The Free Market Center
The Free Market Center
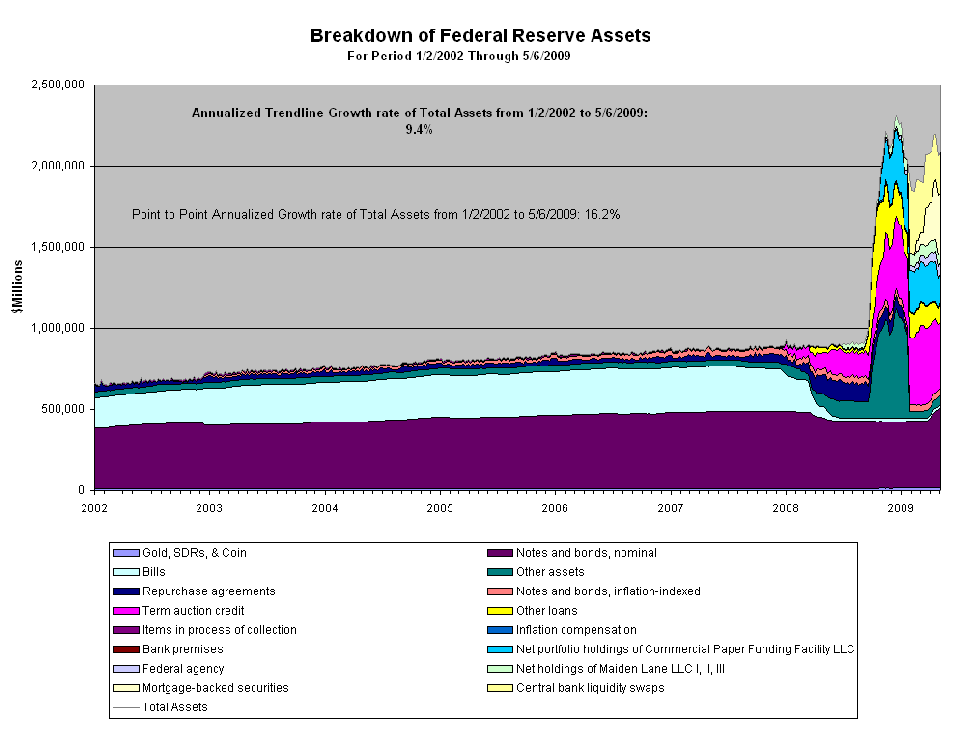
Until 2008 the Fed maintained a fairly consistent breakdown of the assets on its balance sheet. It may have grown too fast (or too slow in the minds of some), but it did so by sticking to the same tools.
As of 2008 the scope of activities and assets of the Fed has changed dramatically. Do these figures depict a central bank run amok? A picture speaks a thousand words.

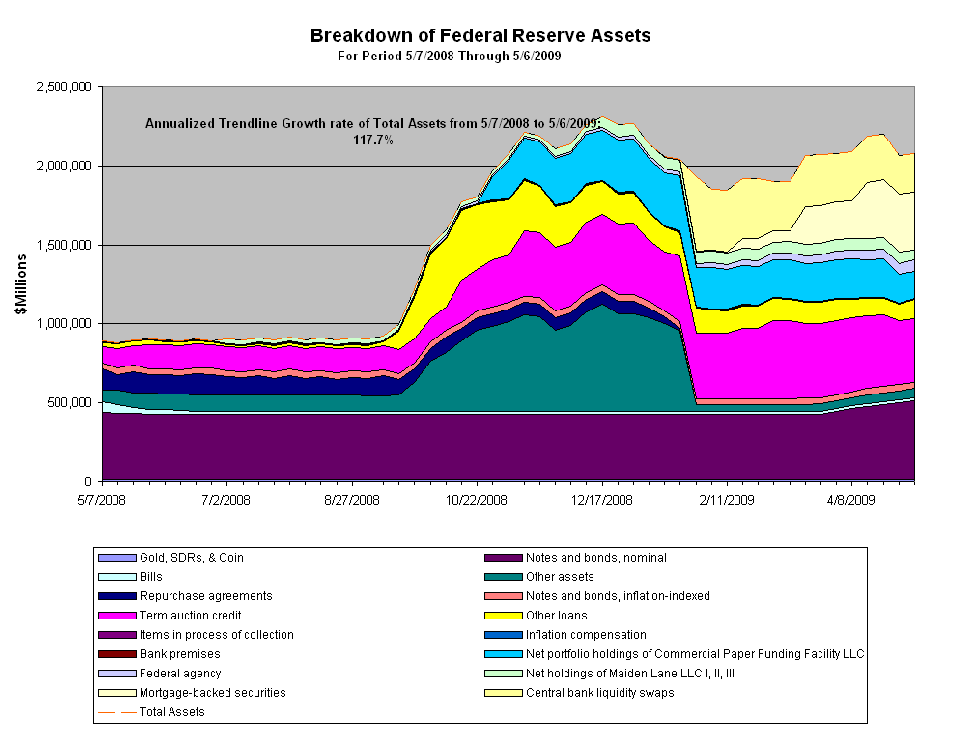
During 2008 the composition of the Fed's balance sheet changed dramatically. It significantly reduced it's holding of Treasury Bills, slightly reduced it's holding of Note and Bonds, and began the acquisition of an array of other assets. Total assets did not grow much, but the composition changed.
In about September of 2008 the buying binge began; assets exploded from about $800 Billion to over $2 Trillion. (The sudden decline in Other assets and the rise in several other categories in early 2009 result from a shift in the Fed's accounting. They don't present these figures on a consolidated basis, and I haven't attempted to restate these figures.)

© 2010—2020 The Free Market Center & James B. Berger. All rights reserved.
To contact Jim Berger, e-mail: