The Free Market Center
The Free Market Center
| Shoe Productivity Increases | 2.00%/Month |
| Wheat Productivity Fixed | 0.00%/Month |
Money Supply
Increases |
2.00%/Month |
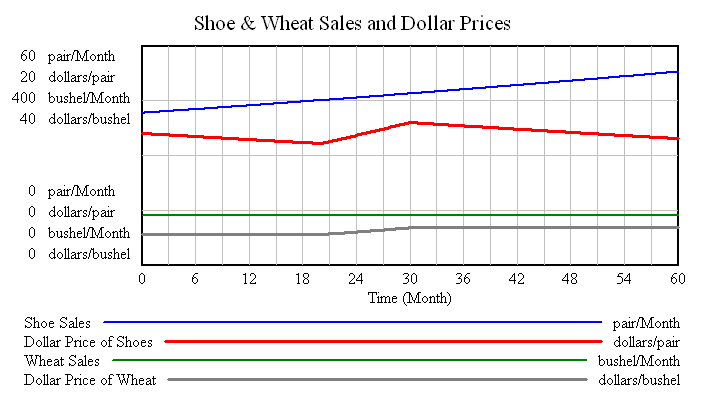
In this first of the money surge scenarios production increases by 2% per month throughout the 60 months (as in all scenarios.)
Money growth surges from 0% per month to 2% per month during months 20 through 30. It then returns to no growth.

Combining these influences shows even more starkly the influence of changes in the quantity of money.
© 2010—2020 The Free Market Center & James B. Berger. All rights reserved.
To contact Jim Berger, e-mail:
You can see the counteracting influences of increasing production and money growth in one chart. Increased production causes the dollar price of shoes to decline until the surge in money growth counteracts that trend for ten months. Dollar prices for shoes start to decline again after month 30.
Notice, also, how money growth causes wheat dollar prices to rise temporarily—in spite of fixed production—then level off at a higher level.