The Free Market Center
The Free Market Center
| Shoe Production Fixed | 0.00%/Month |
| Wheat Production Increases | 1.50%/Month |
| Money Supply Fixed | 0.00%/Month |
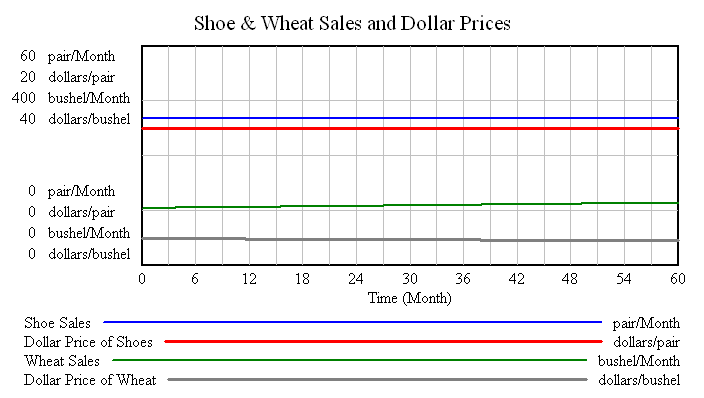
In this scenario the production of wheat increases by 1.5% per month.
Note: The scale of the chart makes the slope of changes in wheat a little difficult to notice.

Changes in wheat production cause changes in behavior of sales and dollar prices similar to the behavior caused by changes in shoe production. In this case increased production of wheat causes sales to increase and dollar prices to decline, while having no impact on sales and dollar prices of shoes.

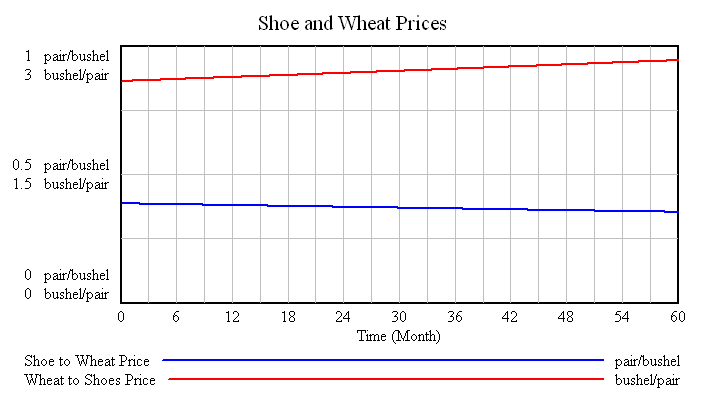
Similar to shoes, as the production of wheat increases the direct exchange prices of these two goods head in opposite directions.
The increased quantity of wheat causes their price in pairs of shoes to decline. You have to give up fewer pairs of shoes for each bushel of wheat (the blue line).
© 2010—2020 The Free Market Center & James B. Berger. All rights reserved.
To contact Jim Berger, e-mail:
You can see how changes in the production of a different product causes similar patterns of behavior.