The Free Market Center
The Free Market Center
| Shoe Production Decreases | -2.00%/Month |
| Wheat Production Fixed | 0.00%/Month |
| Money Supply Fixed | 0.00%/Month |
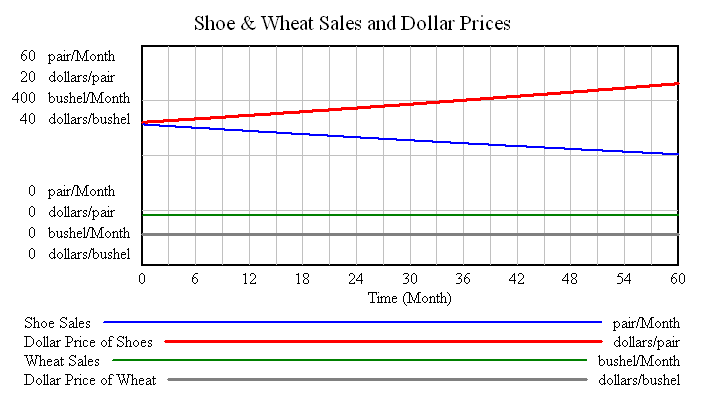
With these charts we see what happens when the production (and sales) of shoes declines, while wheat production and money supply remain fixed.

As production of shoes decreases, shoe sales also decrease. At the same time the dollar price per pair of shoes increases. The change in shoe production has no effect on the production, sales or dollar price of wheat.
With the supply of money fixed the market can read the increase in the dollar price of shoes as information that production has decreased relative to wheat.

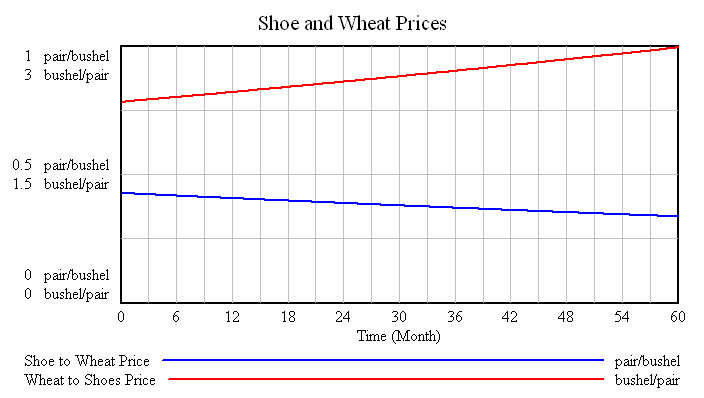
As the production of shoes decreases the direct exchange prices of these two goods head in opposite directions. The decreased quantity of shoes causes their price in bushels of wheat to rise. In other words, you have to give up more bushels of wheat for each pair of shoes (the red line).
© 2010—2020 The Free Market Center & James B. Berger. All rights reserved.
To contact Jim Berger, e-mail:
I think that you can begin to see the important information conveyed by dollar prices. They provide an indication of the pattern of behavior in the relative rate of production of goods in the market. These last two examples showing changes in the production of shoes demonstrate how dollar prices move inversely to changes in production. Production increases; dollar prices decline. Production decreases; dollar prices rise.