The Free Market Center
The Free Market Center
| Shoe Production Increases | 2.00%/Month |
| Wheat Production Fixed | 0.00%/Month |
| Money Supply Fixed | 0.00%/Month |
From the base established with no changes in production or money we begin to experiment with changes in production while maintaining a fixed money supply.

With a fixed money supply and a monthly increase in the production of shoes, we begin to see some interesting things happen.
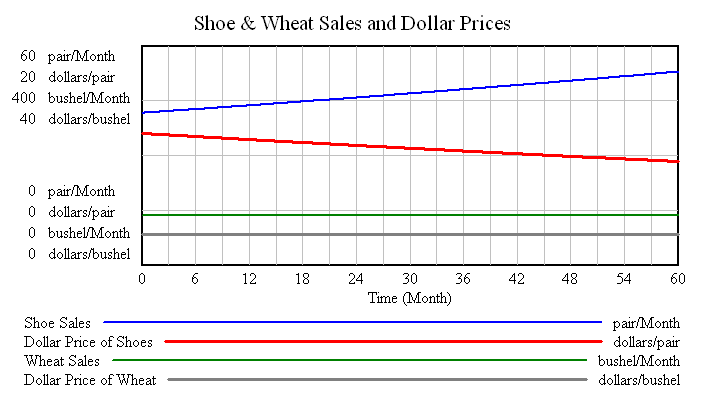
As production increases shoe sales also increase (blue line). At the same time the dollar price per pair of shoes declines (red line). The change in shoe production has no effect on the production, sales or dollar price of wheat.
With the supply of money fixed, the market can read the decline of shoe dollar prices as information that production has increased relative to wheat.

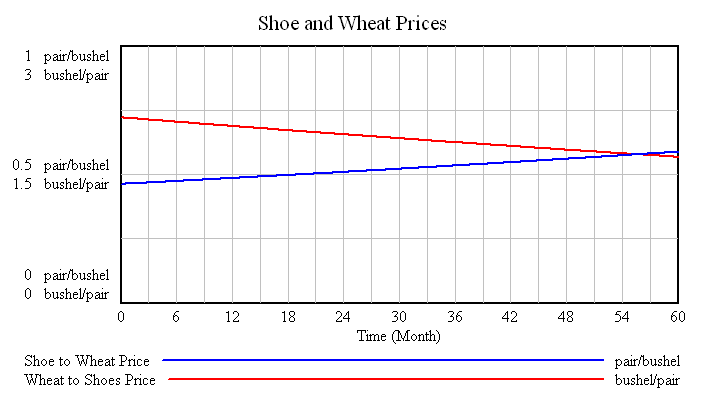
As the production of shoes increases the direct exchange prices of these two goods head in opposite directions. The increased quantity of shoes causes their price in bushels of wheat to decline. In other words, you have to give up fewer bushels of wheat for each pair of shoes (red line).
One more example of the relationship between dollars prices and direct exchange prices might help:
In month 30:
$10.66/pair divided by 5.56/bushel = 1.92 bushel/pair
$5.56/pair divided by 10.66/bushel = 0.52 bushel/pair
© 2010—2020 The Free Market Center & James B. Berger. All rights reserved.
To contact Jim Berger, e-mail:
With one simple change to the action in the little market we begin to see the valuable information transmitted by dollar prices. The declining dollar prices of shoes indicates the increasing production and sales of shoes. The fixed dollar prices of wheat indicate no change in the production and sales of wheat.