![]()
The Free Market Center
![]()
The connections between productivity (defined as a rate: i.e. production per unit of time), population increases, inflation (monetary expansion), and prices provide a prime example. Many think that the first three variables act in concert to push prices higher. Let me clarify one at a time.
First, if productivity (defined as production per unit of time) increases in an economy in which the population level remains the same, the quantity of money remains constant, and the demand for money held as a cash reserve remains constant, prices will tend to decline (particularly in the areas of productivity increase.)
Second, if productivity remains constant, the population level remains the same and the quantity of money increases (while the demand for cash remains unchanged), prices will tend to increase (although not uniformly.)
Thirdly, if productivity remains constant, the quantity of money remains constant, and the population increases, the price of labor would tend to decline but other prices would tend to remain the same. People tend to find it tricky to determine the effect of population changes on prices because they forget that the quantity of dollars bidding for a quantity of goods, not the size of the population, determines dollar denominated prices.
Thus, if productivity, population and inflation (monetary expansion) all increased, you would have three interrelated variables pushing prices in different directions. Productivity increase would tend to push prices down; population increase would tend to push wage rates down; and inflation (monetary expansion) would tend to push prices up. The interdependent nature of these variables makes it impossible to calculate the magnitude of price changes, the direction of those changes, nor the sectors effected.
In addition, to misinterpreting causal connections, economics discussions often confuse reinforcing and balancing processes, and even more frequently they misunderstand the shifts in dominance from reinforcing processes to balancing processes. By doing so they can grossly misinterpret the long term outcomes of behaviors in the economy.
In simple terms, a reinforcing process tends to grow in strength or magnitude over time because of feedback. Systems thinkers frequently use the snowball rolling down a hill as a metaphor for a reinforcing process. The compound growth of savings interest provides a good example.
A balancing process, on the other hand, tends to seek a goal. Home heating systems provide an excellent example of a balancing process. The furnace keeps running until the room temperature reaches that set on the thermostat (the goal) then it shuts off. Mortgage amortization provides a good financial example of a balancing process.
Most lay people, and a good many economists, treat general price increases (frequently called “inflation”) as a reinforcing process. They apparently believe that the economy does not correct for the perpetual increase in the money supply. They seem to think we still suffer (generally) from the effects of monetary expansion in 1980s, 1950s, or even the 1920s.
First, as I mentioned earlier, the effects of inflation (monetary expansion) do not appear in an aggregate—hitting all sectors of the economy at once. Inflation affects one sector before another, rippling through the whole economy.
Second, the market acts as a balancing process. The dollar prices of market goods tend to reflect values of goods (including money) relative to each other in the current time. A picture might help:
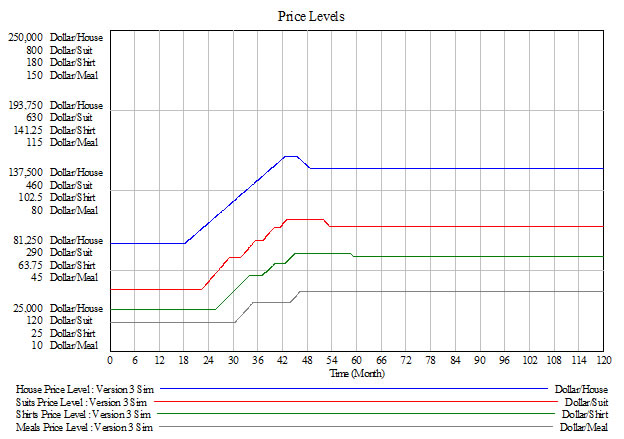
Without going into all the details, I generated this diagram with the model of an economy of five goods (four plus money). It shows the effect of a one time injection of money into this economy during month 18. In this case, the money enters the housing market first, and dollar/house prices start to rise immediately. The prices of the other three commodities begin to rise after time lags. From month 18 through month 60, the prices of the different commodities adjust to re-establish their relative dollar price values in terms of the new quantity of dollars.
After month 60, the balancing processes of the market have achieved their goals and the relative prices remain constant—although at a higher dollar price. Although far more complex than this example, the market works the same way. After completing the adjustment process, the original increase in money has no lingering effect.
By increasing the supply of money, the Fed sends these price ripples through the economy causing temporary dislocations and misallocation of resources. But the market—a balancing process—always adjusts. Herein lies the essence of the Austrian Business Cycle Theory. The larger the price ripples created by the Fed the larger the market correction—boom and bust.
I advocate the use of systems thinking—and more particularly System Dynamics—to understand economic concepts so that people will not make the error of drawing illogical parallels or combining stocks (levels) and flows (rates).
The term “rich” frequently refers to people with large incomes (a flow), yet those same people may save very little of what they earn and have relatively small net-worths (a stock). Also, conversations about national and international economics continually confuse and combine stocks and flows. Politicians and the popular press refer to “the federal deficit” as if it amounted to a growing stock. The term refers to a net flow for one year. They then proceed to compare the federal debt (a stock) with the Gross National Product (a flow) without explaining the meaning of the relationship they allege.
You cannot sever the relationship between stocks and flows, but you should not also confuse or combine the two. Stocks consist of accumulations of units measured at points in time. Flows consist of instantaneous rates of accumulation measured in units per unit of time. They have, therefore, different units of measure. Miles cannot equal miles-per-hour. Gallons cannot equal gallons-per-minute. And dollars cannot equal dollars-per-year. To know the amount of the accumulation in a stock you must know the time period (or number of time periods) over which the units of flow have accumulated. But you cannot add the two. You cannot say you traveled 20 miles plus 50 miles per hour and get a meaningful result.
Variable |
Stock/Flow |
Units |
|
ND = National Debt (Private) |
Stock |
Dollars |
|
FD = Federal Debt (Legitimate) |
Stock |
Dollars |
|
GE = ongoing expense of all government entities |
Stock |
Dollars |
|
OGD = Other Government Debt |
Stock |
Dollars |
|
GDP = (Gross Domestic Product) |
Flow |
Dollars/Year |
|
Total Debt Illusion |
Stock or Flow? |
Dollars or Dollars/Year? |
© 2010—2020 The Free Market Center & James B. Berger. All rights reserved.
To contact Jim Berger, e-mail: